How to plot 2D data using gnuplot
As the publisher of this web site, I am interested in visualizing readership growth over time. With that in mind, I set out to plot the number of page views and clicks over time.
Linux is well stocked with data plotting software. This 3-part series introduces gnuplot, a command-line tool, to plot two-dimensional time-series data. Parts 1 and 2 explain how to plot a points graph; part 3, a bar chart.
Available to me is an input file containing, among other things, the number of page views and ads clicks from 2005 to 2014.
Date    Page views  Clicks
2005-08-01  9   0
2005-08-02  65  1
2005-08-03  20  0

2014-04-28  2811 8
2014-04-29  2862 10
2014-04-30  2256 2
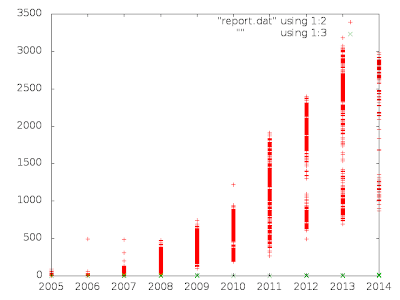
To graph both page views and clicks against time, the minimal gnuplot command sequence is as follows:
set terminal png
set output "webstats.png"
plot "report.dat" using 1:2, \
     "report.dat" using 1:3
The first 2 commands specify respectively the output type (png format), and the output filename (webstats.png).
The third command specifies two plots with the same raw input data file(report.dat). The independent variable ("x") in both plots is the first field in the input file (the "1" in 1:2 and 1:3). The dependent variable ("y") is field 2 and field 3 respectively.
You can enter each command interactively in gnuplot. Or put all the commands in a script, say mystats.gp, and pipe the file to gnuplot.
$ cat mystats.gp |gnuplot

The output graph plotted by the above commands is rather unreadable. The rest of this post explains how to turn that into this: 
Below is the complete script to generate the nice looking graph. Please consult the official user manual for details.
# Plot style
set style data points

# Term type & background color, canvas size
set terminal png background "#330000" size 1920, 960 \
 font "/usr/share/fonts/truetype/msttcorefonts/Arial.ttf,18"

# Output file name
set output "webstats.png"

# Input data configuration
# set datafile separator ","
# set datafile missing "?"

# Independent variable (X) = Time series
set xdata time
set timefmt "%Y-%m-%d"
set format x "%Y/%m/%d"

# Specify subset date range
xstart="2008-01-01"
xend  ="2014-06-01"
set xrange [xstart:xend]

# Define custom display styles
set style line 1 lt 1 lc rgb "#FFCC66"
set style line 2 lt 2 lc rgb "#FF00FF" pt 6
set style line 3 lc rgb "#FFFFFF"

# Axis tic marks
set xtics textcolor linestyle 3 rotate
set xtics xstart, 7776000, xend
set bmargin  8

set ytics  textcolor linestyle 1
set y2tics textcolor linestyle 2

set tics nomirror

# Axis labels
set xlabel  "Date"  tc ls 3  offset 0,-3
set ylabel  "Count" tc ls 3
set y2label "Count" tc ls 3

# Key (Legend)
set key font "/usr/share/fonts/truetype/msttcorefonts/Arial.ttf,16"
set key tc ls 3
set key top left
set key box ls 3 lw 2 height 2  spacing 3
set key title "Legend"
set key Left

# Misc.
set title "Web Site Stats" tc ls 3
set grid
set border linewidth 1 linestyle 3

# Plot:  Skip line 1 (heading)
plot "report.dat" every ::1 using 1:2     \
       title "#PageViews" axes x1y1 ls 1, \
     ''  every ::1 using 1:3              \
       title "#Clicks"    axes x1y2 ls 2
Plotting style
set style data [points| linespoints| lines]
Specify the default plot style.
The points style draws a small disjoint symbol for each "y" data value.
If you prefer adjacent symbols to be connected by a line, use the linespoints style.
Want lines to connect the adjacent data values but no symbols? That is the lines style.
Terminal type
set term png background "#330000" size 1920, 960 \
 font "/usr/share/fonts/truetype/msttcorefonts/Arial.ttf,18"
The set terminal command specifies the terminal type, the background color, the canvas size, and the default text font.
- Terminal type is a peculiar name to mean the output format. Besides png, other notable types are pdf, jpeg, and latex.
- The default background color is white. If you want a dark background, specify the color in the #RRGGBB format, for instance, #330000. On-line tools are available to help you identify the color code.
- The default canvas size is 640 x 480 pixels. The canvas is enlarged to hold all the required information.
- The default font (Arial) and font size (18) are specified.
Output filename
set output "webstats.png"
Specify the output file within quotes.
Input data configuration
set datafile separator ","
set datafile missing "?"
- By default, gnuplot assumes the fields in the input data are separated by whitespaces (one or more spaces or tabs). If your input file is comma-separated, configure the separator parameter.
- If your input file has missing data, set the missing parameter to a special string that denotes a field does not have a value, for instance, "?". Make sure that the empty fields in the input data file are populated with the "?" string.
Part 2 of this series explains the rest of the commands in the gnuplot script. Part 3 shows how to plot bar charts using gnuplot.
