Offline Java Memory Analysis : Introduction to tools for Heap and Thread Dumps, GC log Analysis
In this article we are going to see different tools which can be used for different Java Memory Analysis in offline. I will try to include all kinds of offline analysis tools. OS process memory monitoring and tools are ignored due to context.
What is offline analysis?
When we do analysis on recorded data , not live data, then it refers to offline analysis.
For Java memory analysis, we will perform analysis on not live data but recorded. For Java memory analysis, we need mainly three type of information of JVM to get to bottom of it.
1. Java Heap Dump : This represents JVM heap memory information
2. Java Core /Thread Dump: This shows running thread state and conditions. The core contains more detail information. For IBM , core and thread dump are same. Different JVM may also include trace files here.
3. GC logs : This shows Garbage collection history in logs.
I will not go detail on each one, lets see the tools only
For All IBM JVM : You need to have IBM Support Assistant. This is a web distribution, you need to run this with Java and your PC will host all tools to gather. Here is the download link. How to setup IBM ISA? Unzip and run start_isa.bat .
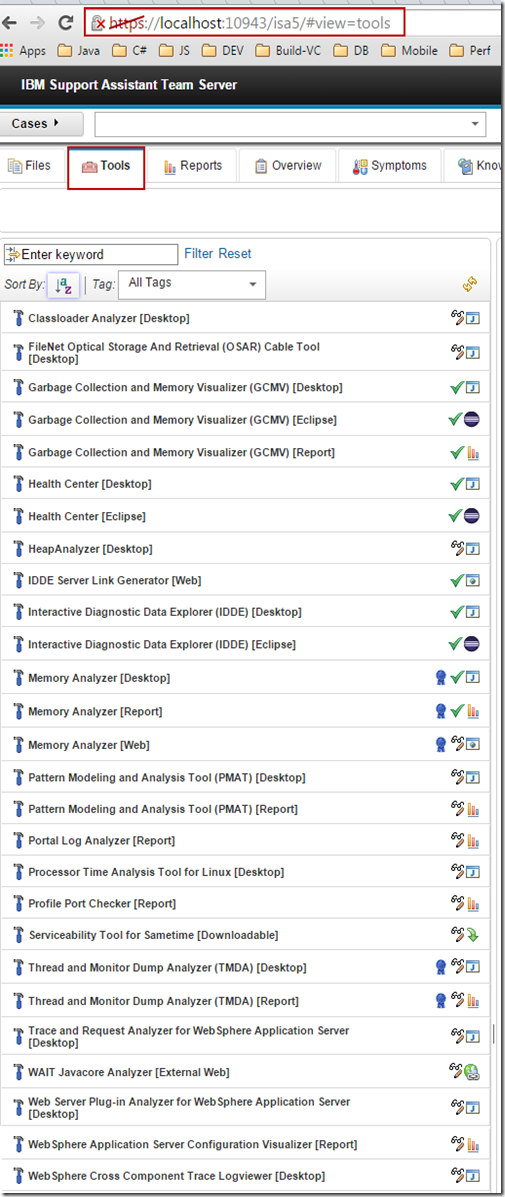
And in browser if you go to this link http://localhost:10911/isa5 You will be redirected here (all of this link & ports are configurable)
You will get 3 type of tools, JNLP web start, eclipse plugins link, web based. If you download and open the JNLP via notepad, you can actually configure JVM configuration. I used make a separate bat file to run JNLP with IBM JVM(non environment run time environment)
Make sure, your PC don’t have global log file as environment variable(if you install HP testing product you will have), Just delete that environment variable. ISA will create a variable path for log for it self and you can run this.
For all Oracle JVM :
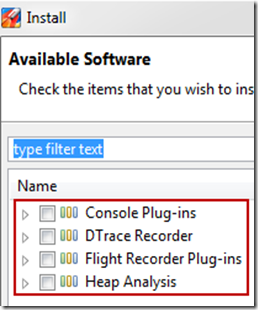
1. Java Mission Control(JMC), Comes free with JDK. But you need to install these tools as plugins.
a. JOverflow / Heap Analysis
b. DTrace Recorder
c. Flight Recorder Plugins
d. Console Plugins

2. Visual VM : Comes free with JDK. Download useful plugins to get best out of it.

Architecturally JMC based on eclipse & Visual VM based on netbeans., so plugins installation process follows process of those IDE in installation (network config+ tools installations)
2. Visual VM : Oracle hprof format heap dump reader
3. JOverflow/Dump Analysis as plugins of Java Mission Control : Oracle hprof format heap dump reader, provides more details analysis than Visual VM.
For IBM JVM: (Java Core file and .trc file)
1. JCA (Java Core analyzer) : This is from IBM support. Download and load text format java Core files.

2. GCMV( Garbage collector Memory Visualizer) standalone or GCMV Eclipse Plugins , comes with ISA
3. Class Loader Analyzer (IBM only) used for class loader analysis from java core and Snap<>.trc file. It comes with ISA.
4. Trace & Request analyzer(IBM only) used for reading Snap<>.trc files . Download Link
5. Thread & Monitor Dump Analyzer (TMDA, IBM only)
Note : .trc is trace file, you need to enable and configure to get proper information.
For Oracle JVM
1. .tdump format: Visual VM
2. hs_err_pid.log format : We need to use Command line tools comes free with JDK.
a. jstack -> Prints Stack Trace
b. jmap -> Heap memory details
And most of the time manually reading as this is text format. We can use filtering. There are also small parser, mainly shell scripts for different filters. Here is one example.
2. PMAT (IBM Pattern Modeling Tool) : Multiple GC log together, comes with ISA
3. One of good 3rd Party Log viewers : GCViewer , Supported formats :
Sun JDK 1.4/1.5 ( -Xloggc: [-XX:+PrintGCDetails] )
Sun JDK 1.2.2/1.3.1/1.4 (-verbose:gc )
IBM JDK 1.3.1/1.3.0/1.2.2 ( -verbose:gc)
IBM iSeries Classic JVM 1.4.2 (-verbose:gc)
HP-UX JDK 1.2/1.3/1.4.x ( -Xverbosegc)
BEA JRockit 1.4.2/1.5 (-verbose:memory)
Some other GC log reader tools you may find in this link.
Note :
1. For both VMs, we can use JProfiler, which is paid tool. If we use yourkit, different version of yourKit supports different version of JVMs, see archive page of yourkit for more details
2. For IBM tools, it is better to use IBM JVM. Either you can download JDK from IBM, or , you can download their development package with eclipse where JDK is present.
3. For IBM JVMs, usually an OOM will create a phd, a javaCore & a trc file. In case you are storing GC logs, verbosegc log will be there.
Please comment if you have any question. Thanks.. :)
What is offline analysis?
When we do analysis on recorded data , not live data, then it refers to offline analysis.
For Java memory analysis, we will perform analysis on not live data but recorded. For Java memory analysis, we need mainly three type of information of JVM to get to bottom of it.
1. Java Heap Dump : This represents JVM heap memory information
2. Java Core /Thread Dump: This shows running thread state and conditions. The core contains more detail information. For IBM , core and thread dump are same. Different JVM may also include trace files here.
3. GC logs : This shows Garbage collection history in logs.
I will not go detail on each one, lets see the tools only
For All IBM JVM : You need to have IBM Support Assistant. This is a web distribution, you need to run this with Java and your PC will host all tools to gather. Here is the download link. How to setup IBM ISA? Unzip and run start_isa.bat .
And in browser if you go to this link http://localhost:10911/isa5 You will be redirected here (all of this link & ports are configurable)
You will get 3 type of tools, JNLP web start, eclipse plugins link, web based. If you download and open the JNLP via notepad, you can actually configure JVM configuration. I used make a separate bat file to run JNLP with IBM JVM(non environment run time environment)
Make sure, your PC don’t have global log file as environment variable(if you install HP testing product you will have), Just delete that environment variable. ISA will create a variable path for log for it self and you can run this.
For all Oracle JVM :
1. Java Mission Control(JMC), Comes free with JDK. But you need to install these tools as plugins.
a. JOverflow / Heap Analysis
b. DTrace Recorder
c. Flight Recorder Plugins
d. Console Plugins

2. Visual VM : Comes free with JDK. Download useful plugins to get best out of it.

Architecturally JMC based on eclipse & Visual VM based on netbeans., so plugins installation process follows process of those IDE in installation (network config+ tools installations)
Java Heap Analysis :
1. Eclipse MAT(including IBM IDDE) supports IBM (phd)& Oracle JVM heap dumps.
2. Visual VM : Oracle hprof format heap dump reader
3. JOverflow/Dump Analysis as plugins of Java Mission Control : Oracle hprof format heap dump reader, provides more details analysis than Visual VM.
Thread Analysis :
For IBM JVM: (Java Core file and .trc file)
1. JCA (Java Core analyzer) : This is from IBM support. Download and load text format java Core files.

2. GCMV( Garbage collector Memory Visualizer) standalone or GCMV Eclipse Plugins , comes with ISA
3. Class Loader Analyzer (IBM only) used for class loader analysis from java core and Snap<>.trc file. It comes with ISA.
4. Trace & Request analyzer(IBM only) used for reading Snap<>.trc files . Download Link
5. Thread & Monitor Dump Analyzer (TMDA, IBM only)
Note : .trc is trace file, you need to enable and configure to get proper information.
For Oracle JVM
1. .tdump format: Visual VM
2. hs_err_pid.log format : We need to use Command line tools comes free with JDK.
a. jstack -> Prints Stack Trace
b. jmap -> Heap memory details
And most of the time manually reading as this is text format. We can use filtering. There are also small parser, mainly shell scripts for different filters. Here is one example.
GC Log Analysis :
As , there are different type of JVM implemented from Open JDK, GC log also have different format. Mostly commonly use IBM & Oracle format. And in each JVM there are different type of GC logs but mostly they follow the general format. Which is text format. Some times , old IBM verbose GC might not be compatible for latest openJVM or Oracle JVM generated GC. How to generate log, I will go details in separate blog.
For Oracle(default : Solaris JVM format) & IBM Verbose GC log reading :
1. GCMV( Garbage collector Memory Visualizer) standalone or GCMV Eclipse Plugins , comes with ISA
For Oracle(default : Solaris JVM format) & IBM Verbose GC log reading :
1. GCMV( Garbage collector Memory Visualizer) standalone or GCMV Eclipse Plugins , comes with ISA
2. PMAT (IBM Pattern Modeling Tool) : Multiple GC log together, comes with ISA
3. One of good 3rd Party Log viewers : GCViewer , Supported formats :
Sun JDK 1.4/1.5 ( -Xloggc:
Sun JDK 1.2.2/1.3.1/1.4 (-verbose:gc )
IBM JDK 1.3.1/1.3.0/1.2.2 ( -verbose:gc)
IBM iSeries Classic JVM 1.4.2 (-verbose:gc)
HP-UX JDK 1.2/1.3/1.4.x ( -Xverbosegc)
BEA JRockit 1.4.2/1.5 (-verbose:memory)
Some other GC log reader tools you may find in this link.
Note :
1. For both VMs, we can use JProfiler, which is paid tool. If we use yourkit, different version of yourKit supports different version of JVMs, see archive page of yourkit for more details
2. For IBM tools, it is better to use IBM JVM. Either you can download JDK from IBM, or , you can download their development package with eclipse where JDK is present.
3. For IBM JVMs, usually an OOM will create a phd, a javaCore & a trc file. In case you are storing GC logs, verbosegc log will be there.
Please comment if you have any question. Thanks.. :)


