These Maps Reveal the Hidden Structures of Choose Your Own Adventure Books

above: Choose Your Own Adventure #2: Journey Under the Sea
via Atlas Obscura
Reading a “Choose Your Own Adventure” book can feel like being lost in a maze and running through twists and turns only to find dead ends, switchbacks, and disappointment. In the books—for those not familiar with them—you read until you come to a decision point, which prompts you to flip to another page, backward or forward. The early books in the series, which began in 1979, have dozens of endings, reached through branching storylines so complex that that trying to keep track of your path can seem hopeless—no matter how many fingers you stick into the book in order to find your way back to the key, fateful choice. You might end up back at an early fork again, surprised at how far you traveled only to reemerge at a simple decision, weighted with consequences that you couldn’t have imagined at the beginning.

above: Choose Your Own Adventure #4: Space and Beyond
The last installment of the original “Choose Your Own Adventure” series came out in 1998, but since 2004, Chooseco, founded by one of the series’ original authors, R.A. Montgomery, has been republishing classic volumes, as well as new riffs on the form of interactive fiction that seemed ubiquitous in the 1980s and ’90s. The new editions also carry an additional feature—maps of the hidden structure of each book.
There have been many maps made for Choose Your Own Adventure books over the years. From A History of Choose Your Own Adventure Visualizations:
Every six months or so it seems as if the entire Internet discovers for the first time that people are making data visualizations of the Choose Your Own Adventure books that were popular in the early eighties. Computer scientist Christian Swinehart’s stunning visualizations are only the most recent to capture the imagination of scores of old fans, academics, and data fanatics.
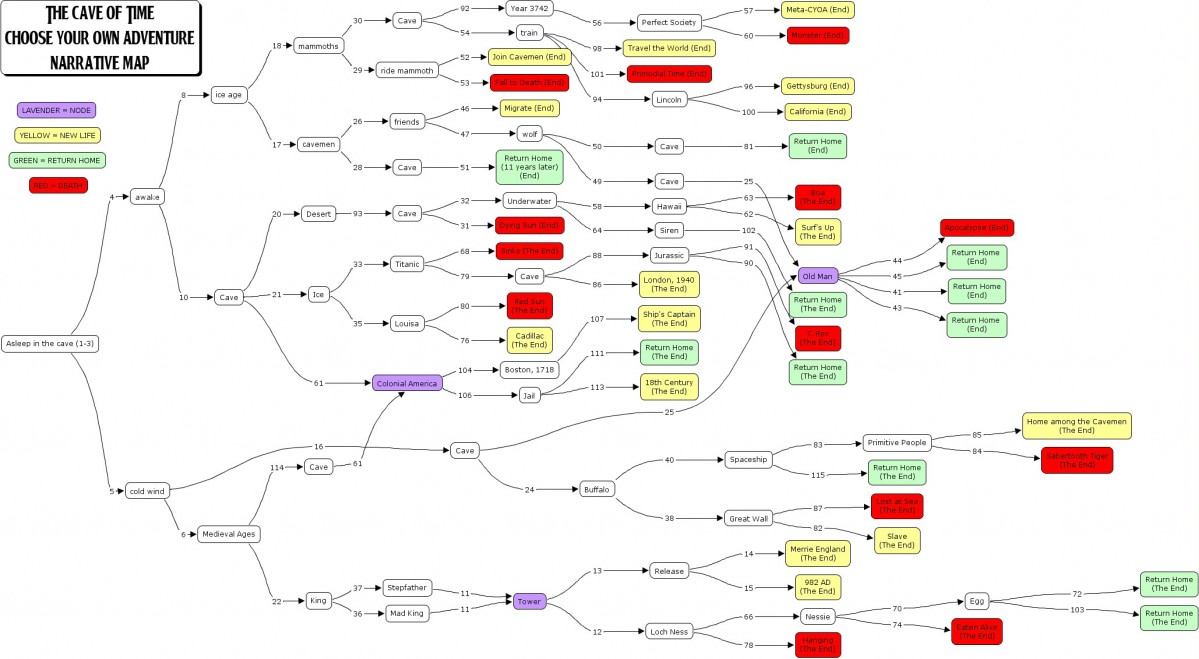
September 2005 I borrow Kirschenbaum’s assignment and revise it for a class at George Mason University on new media. As an example for my students, I map the first book in the series, The Cave of Time (CYOA #1). My own interest in the mapping of these books lies in the moral structure embedded within the novels, in which certain choices are rewarded and others are not. I’m also fascinated by the assumptions the books make about what constitutes a failed or satisfying ending.
March 2008 Sean Ragan turns The Mystery of Chimney Rock (CYOA #5) into a directed graph. Ragan uses AT&T’s open source Graphviz software for his map, which takes a simple text file of options (e.g. “3 -> 4, 3-> 6) and compiles them into a diagram.

July 2009 Designer Michael Niggel creates an analysis of paths and outcomes of Journey Under the Sea (CYOA #2). Niggel finds that over 75 percent of the book’s endings are unfavorable (50 percent will actually end in death).

from Adafruit Industries – Makers, hackers, artists, designers and engineers! http://ift.tt/2n5CkMg
via IFTTT