Bitcoin Price Analysis: Major Support Broken on Expanding Volume and Spread

After weeks of consolidation, bitcoin finally broke through support. The market now finds itself cruising toward prior lows. On expanding volume and spread, the bitcoin market appears ripe for a continuation of the downtrend:

Figure 1: BTC-USD, Daily Candles, Broken Support
Although the current daily candle has yet to close, unless there is a strong influx of demand hitting the market, it stands to reason that bitcoin will be closing a new daily low for the first time since mid-December. Following the stopping action in the low $3,000s, the bitcoin market remained coiled for over a month. However, today marks the first break of these levels once marked as support. To illustrate how coiled the market was and how potentially large the following move could be, check out the 3-Day Bollinger Bands (bbands):

Figure 2: BTC-USD, 3-Day Candles, Bollinger Bands
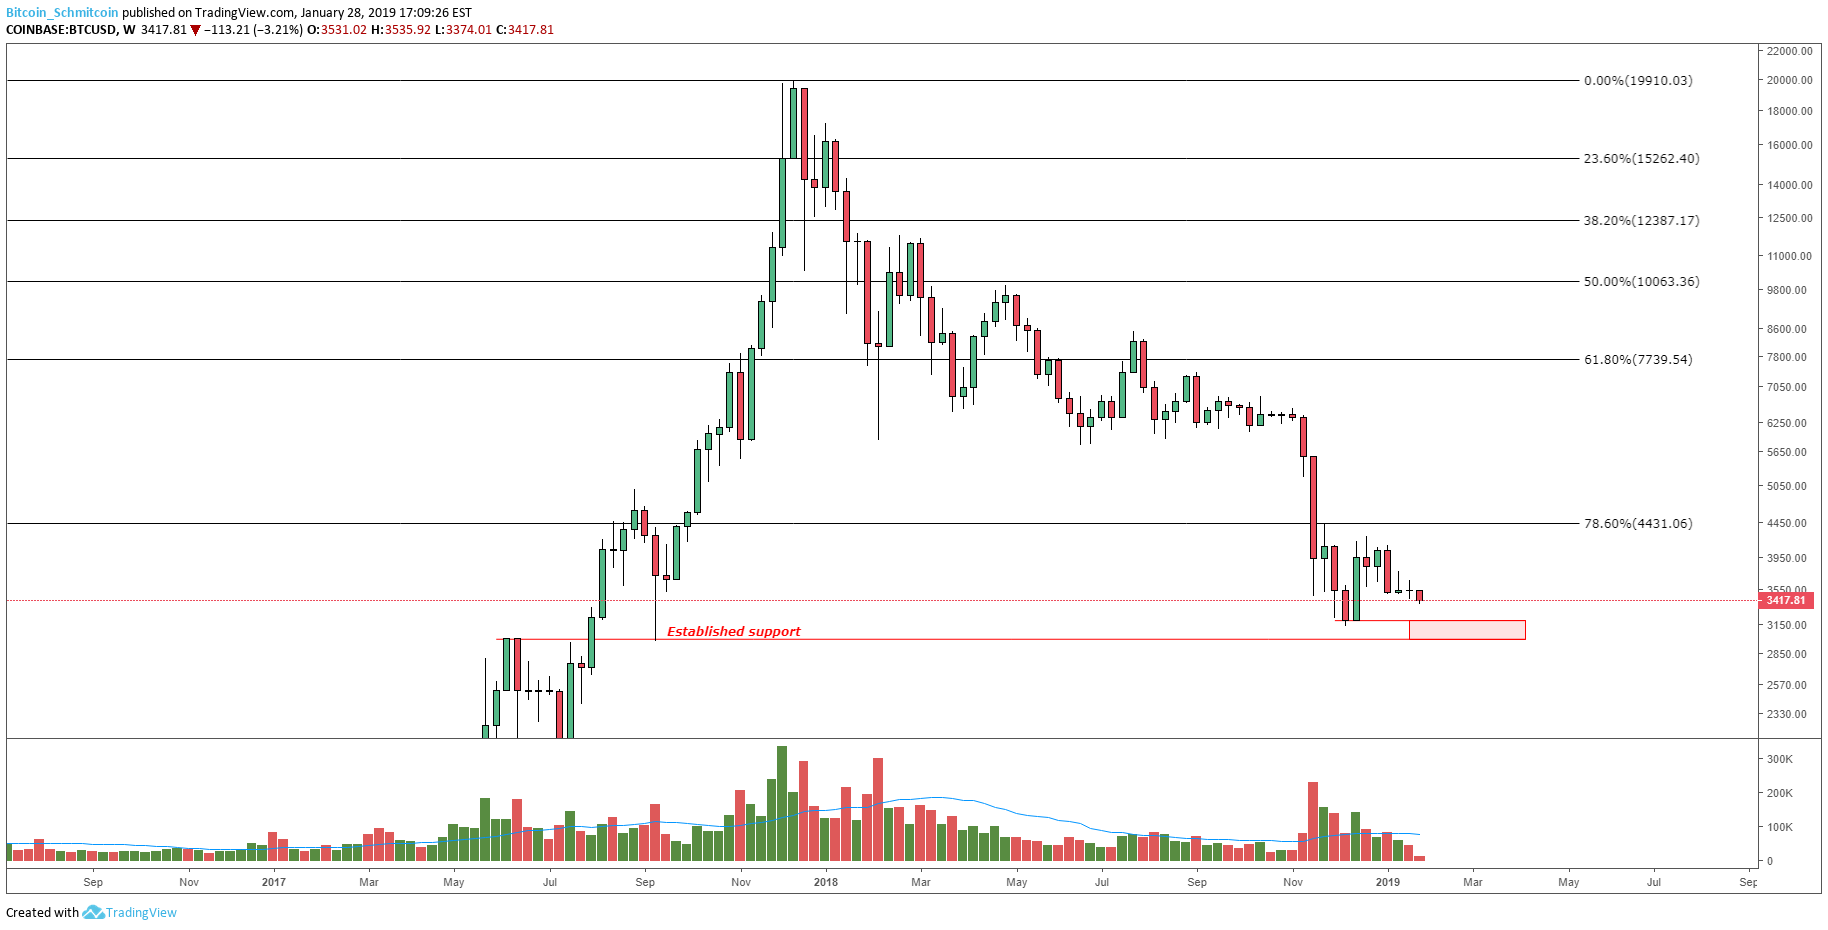
The figure above shows a very tightly wound, consolidated market — a market that previously took several months to consolidate. In just over two months, bitcoin has found itself prepped for another potentially large move. The first logical pitstop on its move is the retest of the prior low in the low $3,000 area. As we move up in timeframes, the weekly candles are showing a zone of support between $3,000 and $3,150:

Figure 3: BTC-USD, Weekly Candles, Next Macro Support Level
The $3,000 level is one of the few established levels that has proven to hold up during a support retest. And, since we have already seen major, climactic volume from the last major sell-off to $3,100, it seems logical that we’ll get a slightly deeper test of the $3,000 values.
From there, we will have to reassess and see how the macro view looks if we can manage a retest of that support zone. A weekly close below that level is a decisively bearish move so we will have to keep an eye out for where the weekly candles close. It’s entirely possible that this level will hold up well under a test given how much buyer interest there was last time around. But for now, we will have to play it candle by candle and see how the bulls react to a retest of the low.
Summary:
- Bitcoin finally broke its multi-week support level.
- The break came about on expanding volume and price spread. Expanding volume and spread coupled with a major support break is a sign of bullish exhaustion and will likely lead to a test of deeper support.
- There is a major support level just below a current low in the $3,000 area. There will likely be buyer interest in this zone, but we will have to measure the response to a test of deeper lows as the market presents itself.
Trading and investing in digital assets like bitcoin is highly speculative and comes with many risks. This analysis is for informational purposes and should not be considered investment advice. Statements and financial information on Bitcoin Magazine and BTC Media related sites do not necessarily reflect the opinion of BTC Media and should not be construed as an endorsement or recommendation to buy, sell or hold. Past performance is not necessarily indicative of future results.
This article originally appeared on Bitcoin Magazine.
by Bitcoin Schmitcoin via Bitcoin Magazine