Bitcoin Price Watch: BTC Could Make a Sustained Move Higher
- Bitcoin price traded higher and broke the $3,550 resistance level against the US Dollar.
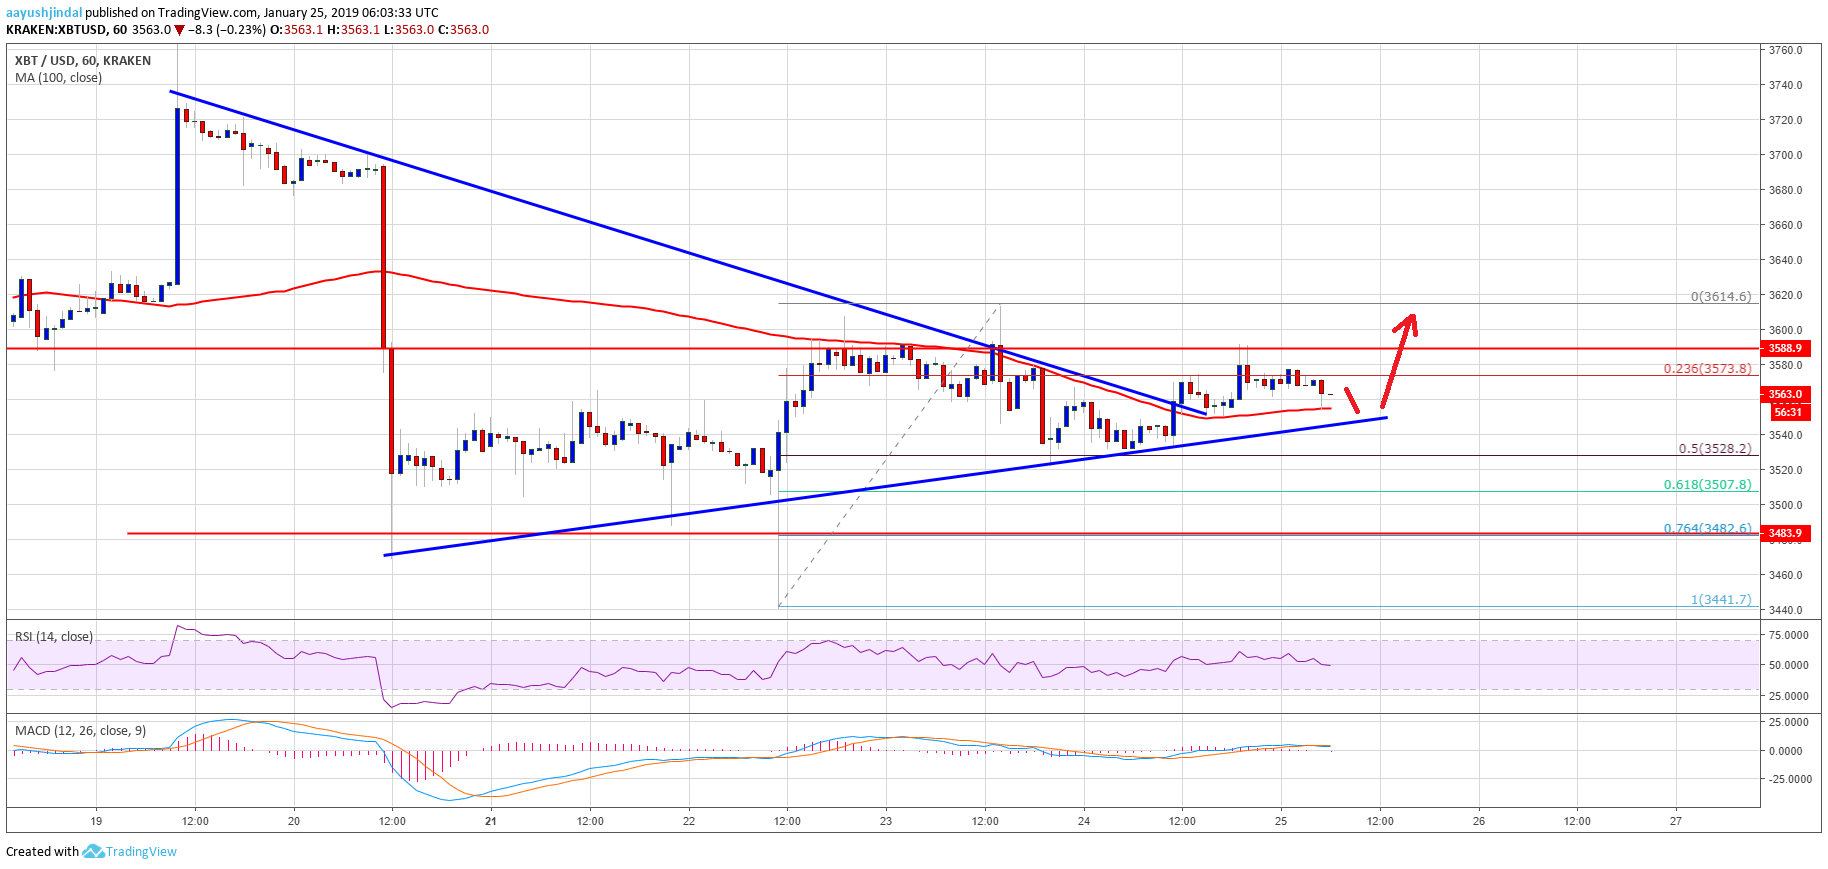
- There is a connecting bullish trend line formed with support at $3,545 on the hourly chart of the BTC/USD pair (data feed from Kraken).
- The price is showing positive signs above the $3,545 level, but it must break the $3,585 resistance.
Bitcoin price is slowly moving higher with positive signs against the US Dollar. BTC needs to overcome sellers near $3,580 and $3,600 for a sustained move higher in the near term.
Bitcoin Price Analysis
After forming a support base above the $3,500 level, bitcoin price started an upside correction against the US Dollar. The BTC/USD pair gained momentum above the $3,545 and $3,550 resistance levels. There was also a close above the $3,550 level and the 100 hourly simple moving average. Besides, buyers pushed the price above this week’s crucial bearish trend line with resistance at $3,555. However, the price is facing a lot of hurdles near the $3,585 and $3,600 resistance levels.
If there is a successful close above the $3,600 resistance, the price may continue to move higher. The next important resistances are $3,750 and $3,785, followed by the key $3,800 barrier. On the downside, an initial support is near the $3,550 level and the 100 hourly simple moving average. Moreover, there is a connecting bullish trend line formed with support at $3,545 on the hourly chart of the BTC/USD pair. Below the trend line, the 50% Fib retracement level of the last leg from the $3,440 low to $3,614 high is at $3,528. Therefore, there many supports on the downside above the $3,520 level.

Looking at the chart, bitcoin price is showing a few positive signs above the $3,550 support level. Having said that, buyers need to gain traction above $3,600 for a sustained move higher. If not, there is a risk of a break below $3,500 and the 61.8% Fib retracement level of the last leg from the $3,440 low to $3,614 high.
Technical indicators
Hourly MACD – The MACD for BTC/USD is mostly flat in the bearish zone.
Hourly RSI (Relative Strength Index) – The RSI for BTC/USD is currently flirting with the 50 level.
Major Support Level – $3,500
Major Resistance Level – $3,600
The post Bitcoin Price Watch: BTC Could Make a Sustained Move Higher appeared first on NewsBTC.
by Aayush Jindal on January 25, 2019 at 12:15PM