Bitcoin Price Weekly Analysis: BTC Trading Near Make-or-Break Levels
- Bitcoin price is trading nicely above the $3,500 support area against the US Dollar.
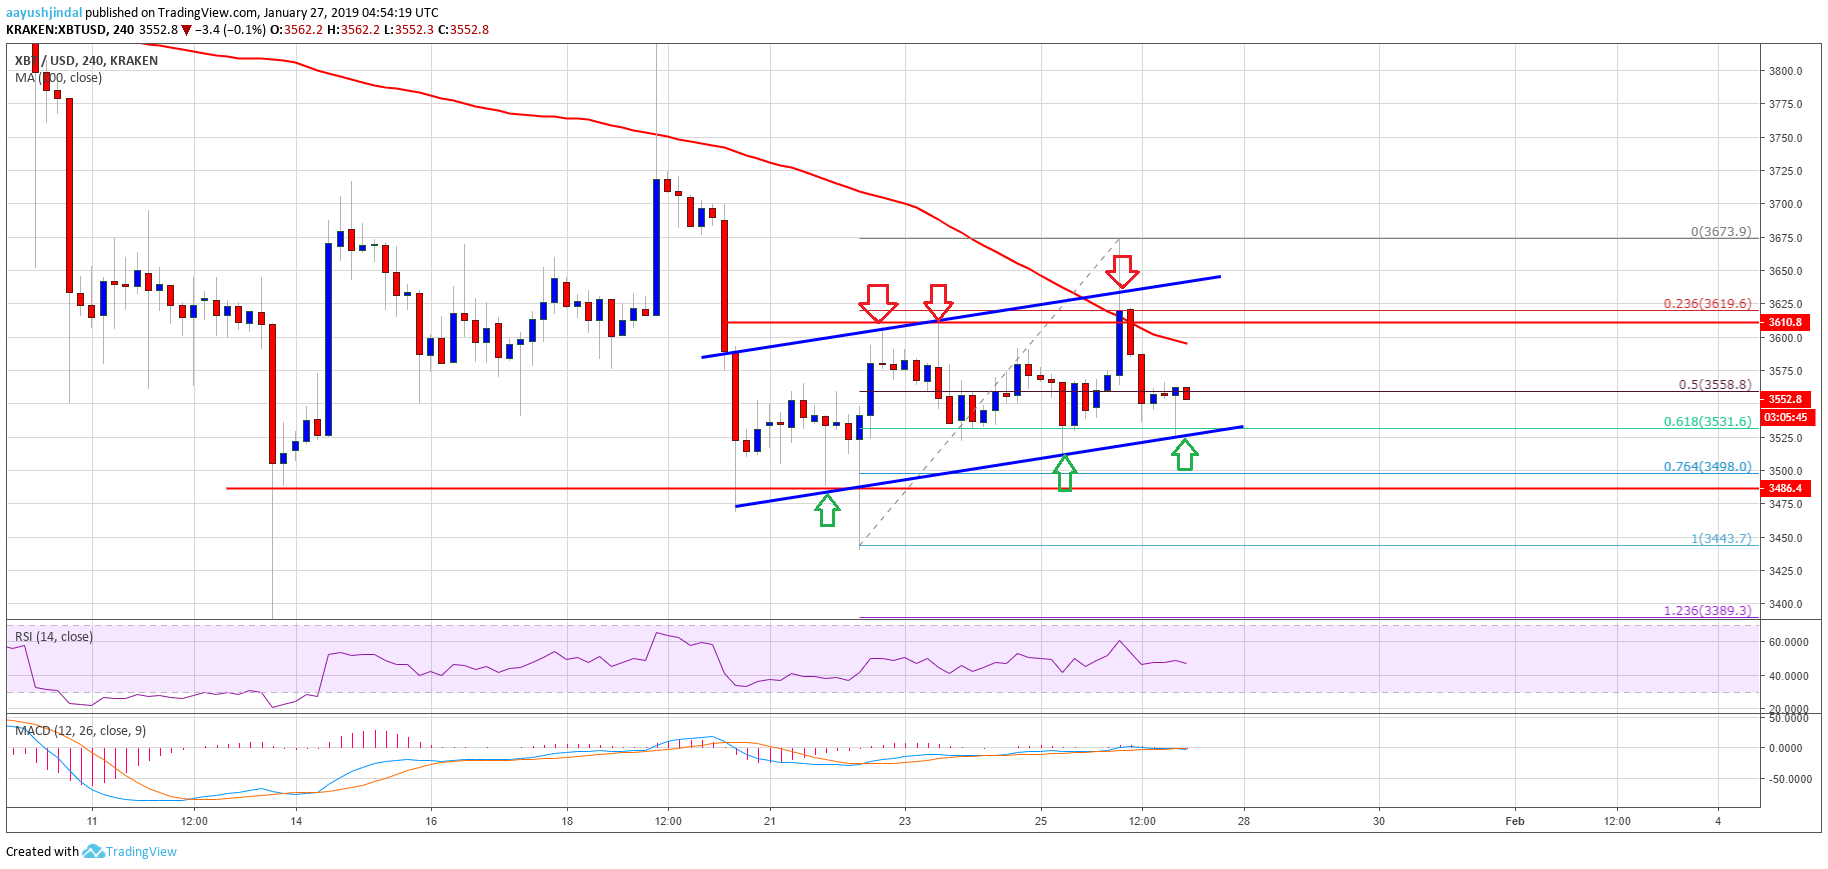
- There is a major ascending channel formed with resistance at $3,650 on the 4-hours chart of the BTC/USD pair (data feed from Kraken).
- The pair needs to surpass the $3,650 and $3,720 resistance levels to gain bullish momentum in the near term.
Bitcoin price made a few bullish breakout attempts, but it failed against the US Dollar. BTC/USD must stay above $3,500 and $3,480 to avoid a downside break in the coming days.
Bitcoin Price Analysis
This past week, bitcoin price remained nicely supported above the $3,500 level against the US Dollar. The BTC/USD pair started a recovery and moved above the $3,550 and $3,600 resistance levels. There was also a break above the $3,620 pivot level. Buyers pushed the price above the 50% Fib retracement level of the last decline from the $3,725 swing high to $3,443 low. However, the upside move was capped by the $3,650 resistance and the 100 simple moving average (4-hours). As a result, the price trimmed gains and settled below the $3,600 level.
At the moment, the price is trading well below the $3,600 level and the 100 simple moving average (4-hours). It traded as high as $3,673 and declined below the $3,575 level. There was a test of the 61.8% Fib retracement level of the last wave from the $3,443 low to $3,673 high. More importantly, there is a major ascending channel formed with resistance at $3,650 on the 4-hours chart of the BTC/USD pair. If there is a downside break below the channel support and $3,500, the price may test $3,480. Below the range support at $3,480, the price may move into a bearish zone towards $3,200.

Looking at the chart, BTC price seems to be struggling to gain traction above $3,600 and $3,650. Should there be an upside break above $3,650, the price is likely to grind towards $4,000 in the near term.
Technical indicators
4-hours MACD – The MACD for BTC/USD is mostly flat in the bearish zone.
4-hours RSI (Relative Strength Index) – The RSI for BTC/USD is currently just below the 50 level.
Major Support Level – $3,500
Major Resistance Level – $3,650
The post Bitcoin Price Weekly Analysis: BTC Trading Near Make-or-Break Levels appeared first on NewsBTC.
by Aayush Jindal on January 27, 2019 at 11:30AM