Ethereum Price Weekly Analysis: ETH Could Accelerate Losses Below $121
- ETH price declined heavily this past week below the $146 and $130 supports against the US Dollar.
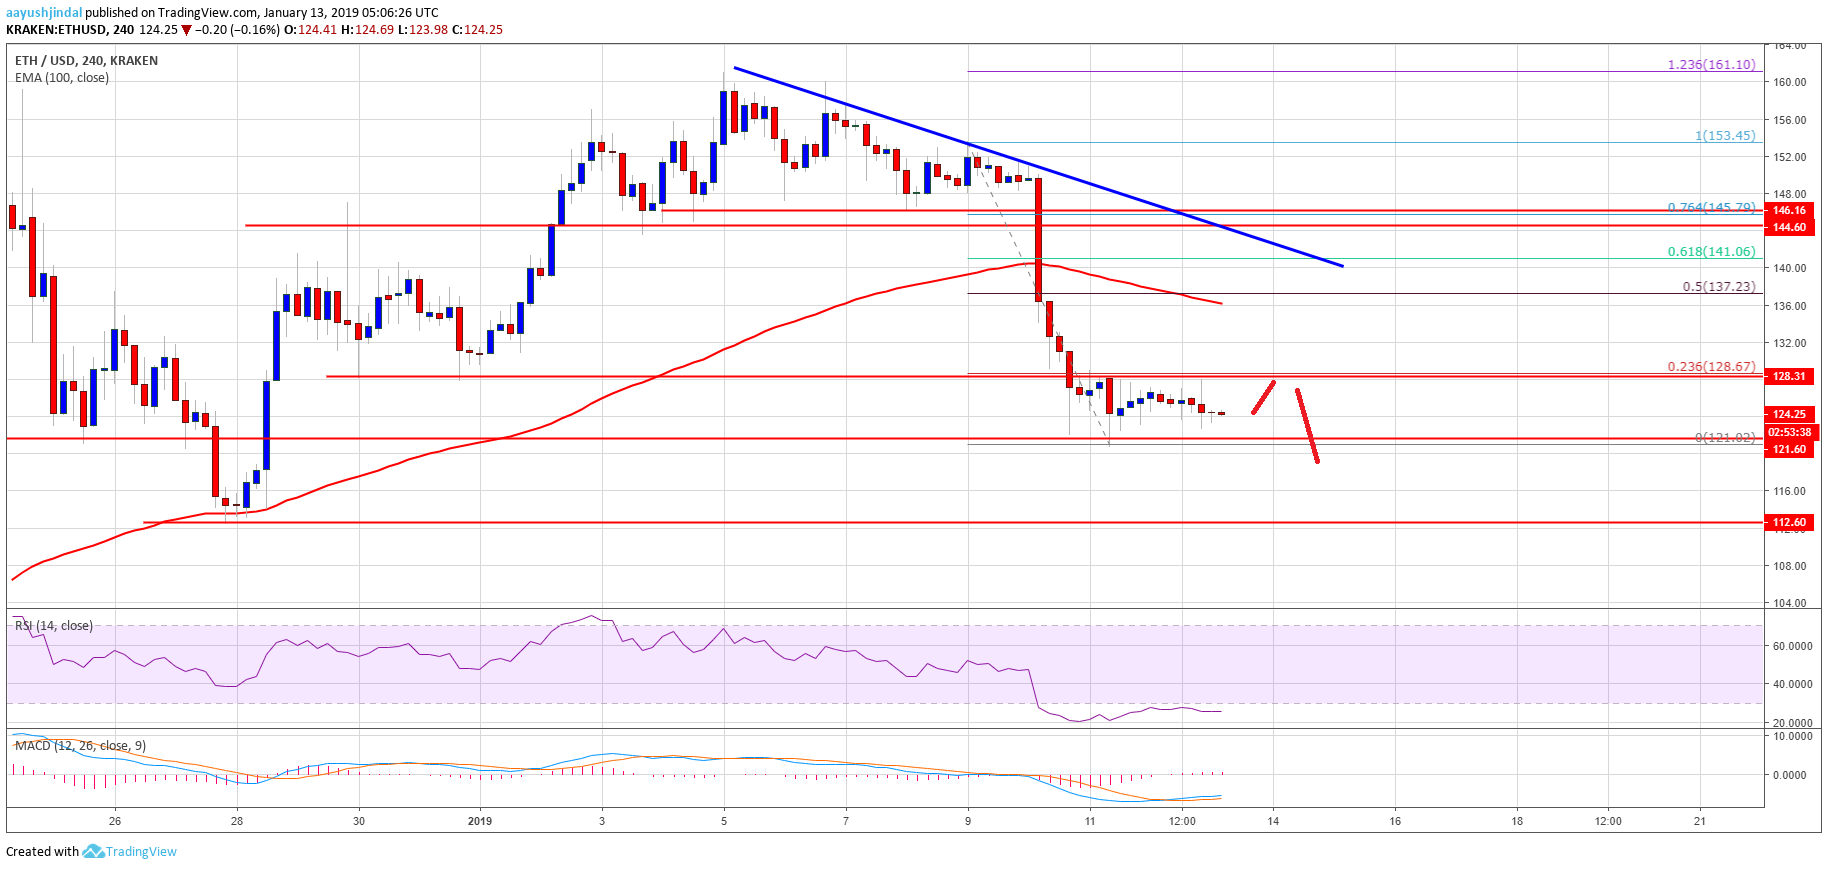
- There is a crucial bearish trend line formed with resistance at $138 on the 4-hours chart of ETH/USD (data feed via Kraken).
- The pair remains at a risk of more losses if sellers push the price below $121 and $120 in the near term.
Ethereum price is trading in a bearish zone versus the US Dollar and Bitcoin. ETH/USD could accelerate losses towards $112 or $108 if there is a break below $121.
Ethereum Price Analysis
This past week, ETH price tumbled below the $146 and $140 support levels against the US Dollar. The ETH/USD pair even traded below the $130 support and the 100 simple moving average (4-hours). The decline was such that the price tested the last swing low of $120-121. Later, the price started consolidating losses and traded in a range above the $121 level. An initial resistance is near the $128-129 zone (the previous support).
Besides, the 23.6% Fib retracement level of the last decline from the $153 high to $121 low is also near the $128 area. Therefore, it won’t be easy for buyers to clear the $128-129 resistance zone. If there is an upside break above $128, the price may climb towards the $138 zone. The 100 simple moving average (4-hours) is positioned near the $138 area to prevent further gains. Moreover, the 50% Fib retracement level of the last decline from the $153 high to $121 low is at $137. Finally, there is a crucial bearish trend line formed with resistance at $138 on the 4-hours chart of ETH/USD. Therefore, the $128 and $138 levels are the main hurdles for buyers in the coming days.

The above chart indicates that ETH price could decline further if there is a break below the $120 and $121 supports. The next key support is at $112 and $108.
Technical Indicators
4-hours MACD – The MACD for ETH/USD is slightly placed in the bullish zone, with no major recovery sign.
4-hours RSI – The RSI for ETH/USD is well below the 30 level, with a bearish bias.
Major Support Level – $120
Major Resistance Level – $138
The post Ethereum Price Weekly Analysis: ETH Could Accelerate Losses Below $121 appeared first on NewsBTC.
by Aayush Jindal on January 13, 2019 at 10:48AM