Bitcoin Price Analysis: BTC Fundamental and Technical Indicators Diverge
- Bitcoin price trading within tight ranges
- Adoption picking up, positive for BTC in the long-term
- Transactional volume dropping
It’s all about adoption. Luckily, metrics point to increasing participation, a development which is bullish for BTC in the long term. Before we initiate longs, BTC/USD is technically bearish. The position will change after there are substantial gains above $3,800.
Latest Bitcoin News
Fundamentals
Traders, as well as investors, are neck deep in bear territory. However, there is something special about this correction: there is a level of resilience among coin holders. Part of this rejection is because of increasing awareness and Satoshi’s vision-mission statement taking root. Note that Bitcoin is a public blockchain and its source code open. That is why there are divergent interpretations.
On the one hand, some individuals are convinced Bitcoin is not cash but a store of value, a settlement layer where people from all over the world can shield their value from an inflation-resistant network. On the other, BTC can operate as a means of exchange, competing with legal tenders as USD.
Bitcoin going from $3,500 to $1,000,000 a lot less crazy than it getting to $3500 in the first place.
Never underestimate #Bitcoin.
— Alec Ziupsnys (@AlecZiupsnys) February 2, 2019
All the same, we know that just as easy it was for BTC to jump from $0.001 to $1, there is nothing that can prevent Bitcoin from expanding to $20k, 50k or even $250k. It’s all about adoption, and there is movement in that sector.
Candlestick Arrangements

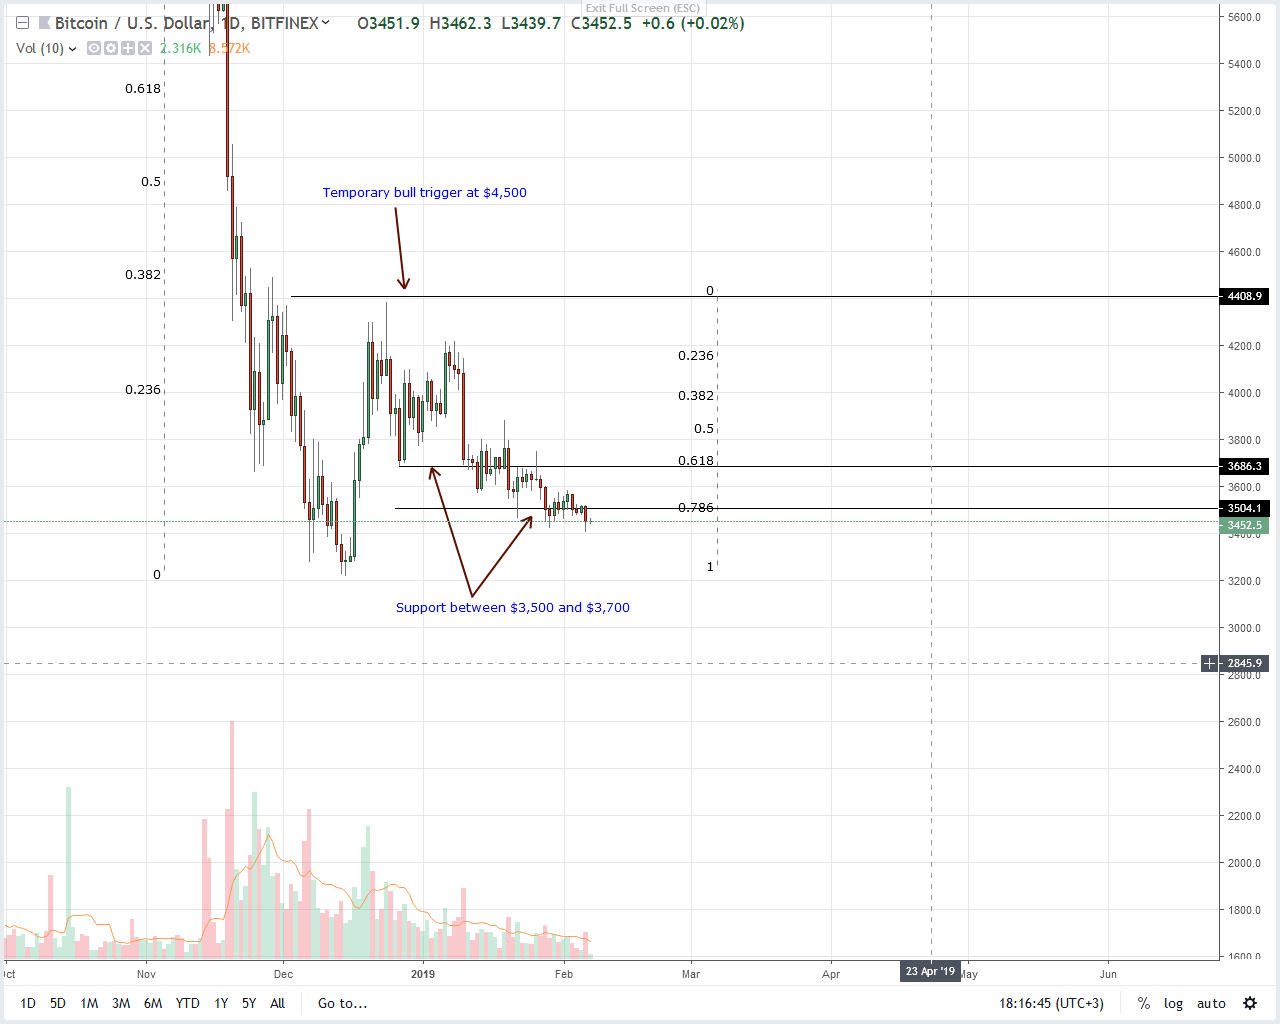
Technically, BTC is under immense sell pressure and is “hanging on.” Like before, bulls have as long as they trend within this $300 range between $3,500 and $3,800. Our trade plan is simple: BTC prices must expand above $3,800 with high trade volumes preferably above 35k before we can think of initiating longs.
The only hindrance is Feb 5 bear candle that threatens to drive prices below Jan 2019 lows. Note that is there is a whole bear bar below Jan 2019 lows and this support level, it will be likely that sellers will press lower reversing gains of late Dec 2018. It’s because of this uncertainty that we recommend patience and even shifting BTC to stables until after there is a defined trend.
Technical Indicators
Transactional volumes are drying up, and BTC/USD is trading within a tight trade range. Because of Jan 6 bear bar with above average volumes—13k versus 10k, we need a counter bull bar with equal or higher trade volume for a trend reversal. These volumes should be above Jan 20’s 20k and even Jan 10’s 35k.
The post Bitcoin Price Analysis: BTC Fundamental and Technical Indicators Diverge appeared first on NewsBTC.
by Dalmas Ngetich on February 08, 2019 at 12:30AM