Ripple Price Analysis: XRP Remains at Risk of Further Declines
- Ripple price declined further and broke the $0.2940 and $0.2900 support levels against the US dollar.
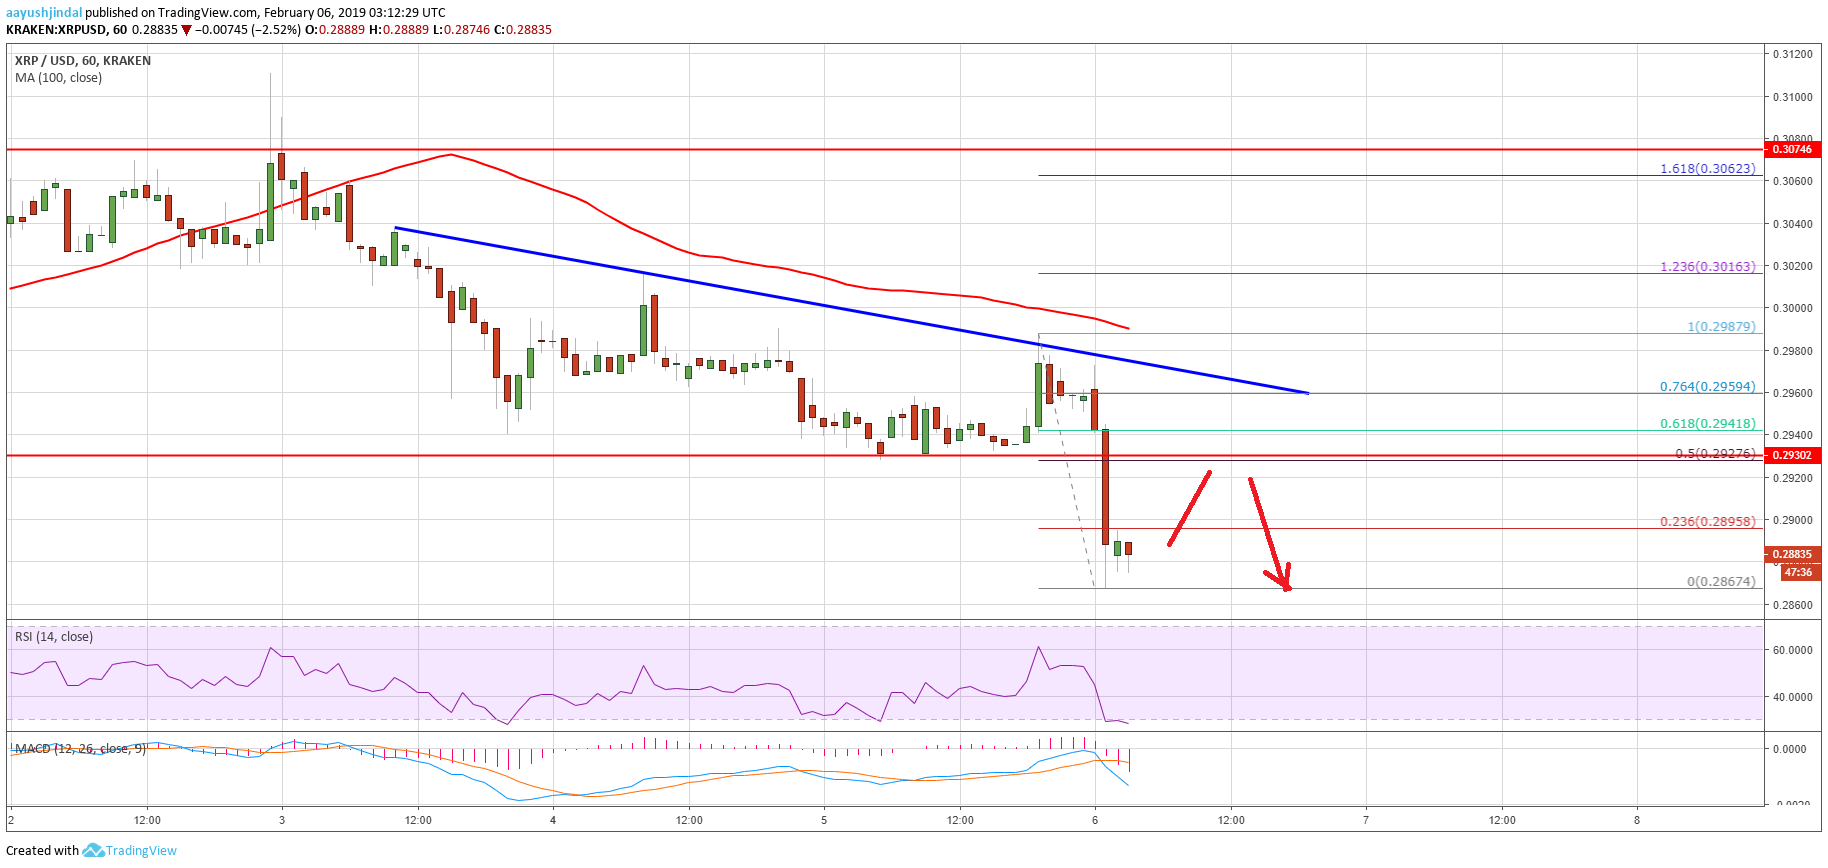
- There is a key bearish trend line in place with resistance near $0.2960 on the hourly chart of the XRP/USD pair (data source from Kraken).
- The pair is trading in a bearish zone and it could continue to move down towards $0.2820 or $0.2800.
Ripple price accelerated losses against the US Dollar and Bitcoin. XRP/USD settled below $0.2940 and any recovery from the current levels could find a strong selling interest.
Ripple Price Analysis
There was a daily close below the $0.3000 support in ripple against the US Dollar. The XRP/USD pair declined further and broke many important supports near the $0.2900 level. Sellers were able to clear the key $0.2940 support and the 100 hourly simple moving average. It opened the doors for more losses and the price declined below the $0.2900 support level. It traded to a new monthly low at $0.2867 and it seems like sellers are in full control. At the moment, the price is consolidating losses above $0.2870, with no bullish angle.
An initial resistance is the 23.6% Fib retracement level of the recent decline from the $0.3110 high to $0.2940 low. However, the main resistances are near the $0.2920 and $0.2940 level. The previous support was also near $0.2940, which is likely to prevent gains. Besides, the 50% Fib retracement level of the recent decline from the $0.3110 high to $0.2940 low is near the $0.2930 level. Finally, there is a key bearish trend line in place with resistance near $0.2960 on the hourly chart of the XRP/USD pair. Therefore, if there is an upside correction, the price is likely to face sellers near $0.2920, $0.2930 and $0.2940.

Looking at the chart, ripple moved into a bearish zone below $0.2960. If sellers remain in action for a long time, there is a risk of a drop below the $0.2800 support level.
Technical Indicators
Hourly MACD – The MACD for XRP/USD is gaining momentum in the bearish zone.
Hourly RSI (Relative Strength Index) – The RSI for XRP/USD has reached the 20 level, with a bearish angle.
Major Support Level – $0.2850
Major Resistance Level – $0.2940
The post Ripple Price Analysis: XRP Remains at Risk of Further Declines appeared first on NewsBTC.
by Aayush Jindal on February 06, 2019 at 10:30AM