Big Prometheus: Thanos, Cortex, M3DB and VictoriaMetrics at Scale
A recent paper from Google that will probably have an impact on the future of large-scale data processing summarizes the situation facing many companies in early 2020:
“Large organizations… are dealing with exploding data volume and increasing demand for data driven applications. Broadly, these can be categorized as: reporting and dashboarding, embedded statistics in pages, time-series monitoring, and ad-hoc analysis. Typically, organizations build specialized infrastructure for each of these use cases. This, however, creates silos of data and processing, and results in a complex, expensive, and harder to maintain infrastructure.”
There are a number of interesting projects and startups addressing this problem in the open-source monitoring world, particularly for teams with dozens or hundreds of Kubernetes clusters using Prometheus for monitoring.
Prometheus, usually combined with Grafana for dashboards and reporting, has become the de-facto standard for open-source monitoring in Kubernetes and one of the Cloud Native Computing Foundation’s most popular projects. (The Apache Foundation also has an open-source APM project called Skywalking that I’m told is big in China.)
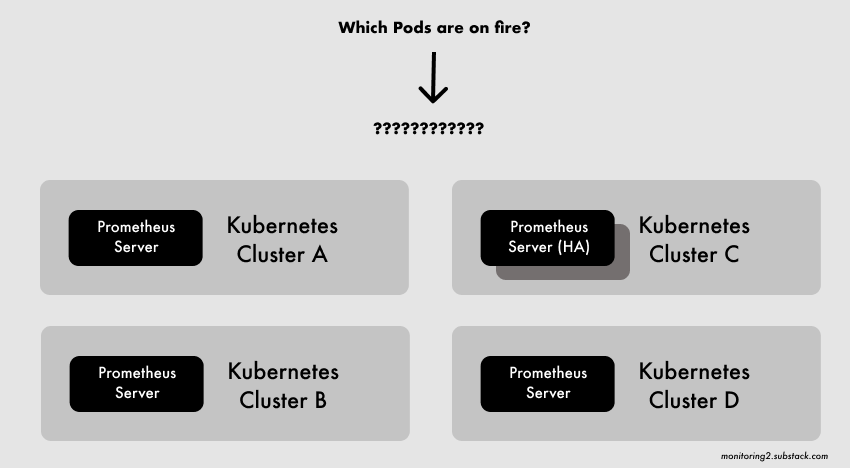
A common configuration is to run a single Prometheus server per Kubernetes cluster, which is getting easier to setup and run with projects like Prometheus Operator. With dozens to hundreds of clusters in an organization—Cloudflare was running 188 in 2017—it’s complicated to maintain and slow to globally query so many Prometheuses (Prometheii?).

There are four major open-source database projects written in Go working on this problem: Thanos, Cortex, M3DB, and VictoriaMetrics. Their goals are similar:
Prometheus compatibility (integrate easily with existing Kubernetes clusters)
Global, fast queries (see all the data from everywhere quickly)
Long-term historical metrics (policies to store long-term metrics cheaply)
High availability (resiliency against crashes without data loss)
Here’s a brief overview:
Thanos and Cortex
Thanos and Cortex are similar enough in terms of the problems they aim to solve that there was a talk at PromCom 2019 (the Prometheus conference) from Tom Wilkie with the delightful title “Two Households, Both Alike in Dignity: Cortex and Thanos”.
Cortex behaves like typical SaaS monitoring where data is pushed to a central location from remote servers (but using native Prometheus APIs). Thanos is less-centralized and data remains within each Prometheus server—which is how Prometheus operates by default. These two different approaches result in different technical approaches for answering global queries like “which of my clusters is on fire?”. Tom Wilkie’s talk has more details.
The other interesting architectural aspect of both projects is they both can leverage cloud-managed services to store long-term historical data (“what was the error rate seven weeks ago?”) in order to lower operational cost.
Thanos can use cheap-ish object-stores like Amazon S3 or Azure Blob Storage, while Cortex prefers more expensive NoSQL stores like AWS DynamoDB or Google BigTable. (Cortex is now adding support for object-stores as well.) This lets teams adopting either project make deliberate choices around cost and performance for historical metrics.
It seems like there will be more collaboration between the projects in the future, and there’s a juicy twitter hot take on it.
M3DB
Uber wrote their own thing, too.
M3DB follows a Thanos-like model, but according to a post from the creator on Hacker News, the main issue in adopting Thanos was that Uber frequently needed historical metrics that were too slow to fetch from an object-store like Amazon S3 and there were massive bandwidth costs when historical data was moving between the cloud and Uber’s on-prem data centers.
There’s now a startup called Chronosphere that has spun off from this work and they’ve raised an $11 million Series-A round from Greylock Partners. According to TechCrunch, it will will take over management of the M3 project going forward.
VictoriaMetrics
Like M3DB, Thanos, and Cortex, the creators of VictoriaMetrics also faced a cost and performance problem. They were inspired by ideas from ClickHouse, a cool kid database created by Yandex that people publish extremely impressive performance and cost metrics for when they run it on a three-year old Intel hardware.
The VictoriaMetrics team, according to their FAQ, is prioritizing low operational cost and good developer/operator experience. There’s even a way to run it in a single node configuration. The performance numbers look impressive, and it seems like they also sell (or plan to sell) some kind of managed cloud service.
Coming soon to a startup near you?
At this point, you mind be asking, “why bother? I’d rather pay [SaaS vendor] and not deal with any of this.”
The interesting thing is [SaaS vendor] may very well be using one of these projects to power the oberservability solution they’re selling. Cortex, notably, is being used by Weave Cloud, Grafana Cloud, and a new enterprise service mesh called AspenMesh. Thanos was developed at (and is presumably still being used by) the gaming software company Improbable and M3DB, of course, is being used at Uber.
Another exciting thing about these projects is that they offer a front-row seat to talented engineers solving hard distributed systems problems related to large-scale monitoring and making different decisions along the way. All this activity suggests a healthy open-source ecosystem that’s supporting a number of observability startups and providing solutions for other companies that need to run some kind of Big Prometheus. There are more high-quality open-source choices than ever.
Thanks for reading. If you enjoyed this newsletter, feel free to share using the link below or subscribe here.
Disclosure: Opinions my own. I am not employed, consulting, or an investor in any of the mentioned companies or their competitors.
from Hacker News https://ift.tt/2T6y7te