Ethereum Price (ETH) Turns Bearish Below $220, Bitcoin Breaks $10.5K
- ETH price failed to continue higher above the $230 and $240 resistance levels against the US Dollar.
- The price started a fresh decrease and broke the key $220 and $218 support levels.
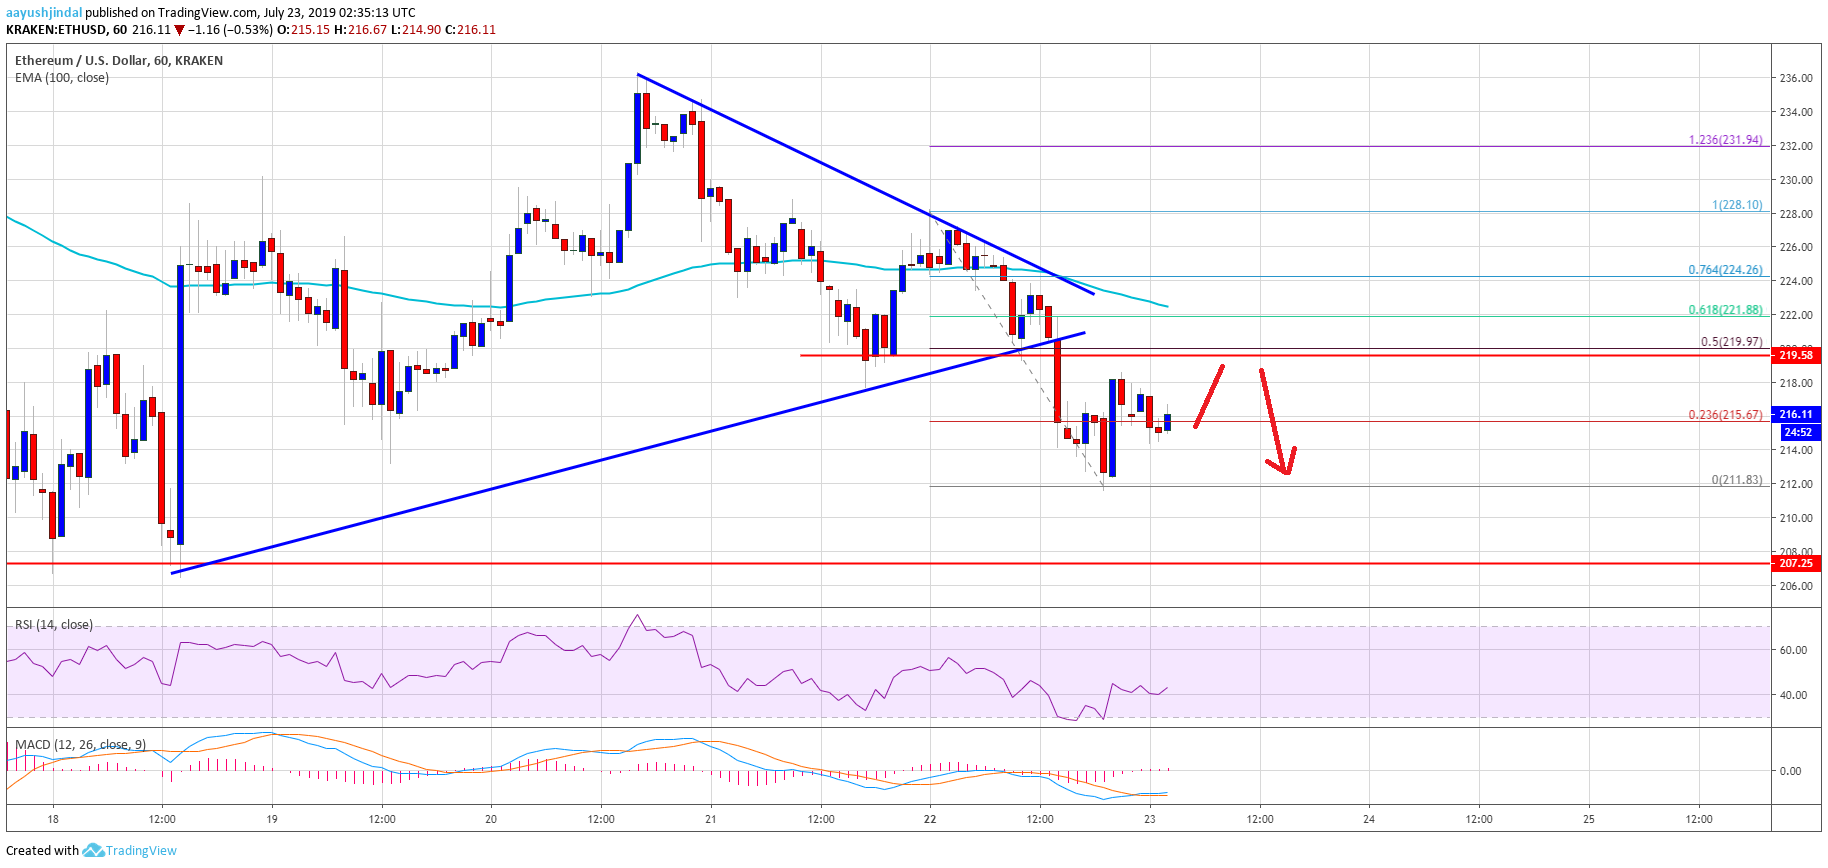
- Yesterday’s highlighted breakout pattern was breached with support near $222 on the hourly chart of ETH/USD (data feed via Kraken).
- The pair is now trading below the $220 support and it might decline further towards the $207 support.
Ethereum price is struggling to gain bullish momentum versus the US Dollar and bitcoin. ETH price remains at a risk of more loses unless it settles above $220 and $224.
Ethereum Price Analysis
After trading towards the $240 level, Ethereum price started a downside correction against the US Dollar. The ETH/USD pair traded below the $230 and $225 support levels. Recently, it consolidated above the $220 support level and near the 100 hourly simple moving average. The price made an attempt to climb back above $230, but the bulls failed to gain momentum.
As a result, there was a downside break below the $220 support level. The price even settled below $220 and the 100 hourly SMA. Moreover, it declined towards the $210 level and a swing low was formed at $211. At the outset, the price is correcting higher towards the $218 and $220 resistances. It broke the 23.6% Fib retracement level of the recent decline from the $228 high to $211 low.
However, the upward move might face a strong resistance near the $220 level. Additionally, the 50% Fib retracement level of the recent decline from the $228 high to $211 low is also near the $220 level to act as a resistance. The main resistance is near the $224 level and the 100 hourly SMA. Therefore, a successful close above $224 is needed for a fresh increase.
On the other hand, if the price fails to break the $218 or $220 resistance, it could continue to decline. An initial support is near the $212 level, below which there is a risk of more losses below $210. The next important support on the downside is near the $207 level.
Looking at the chart, Ethereum price is trading below a major support near $220. Therefore, there is a risk of more losses below $215 and $211 in the coming sessions. To recover, the price must surpass the $220 and $224 resistance levels in the near term.
ETH Technical Indicators
Hourly MACD – The MACD for ETH/USD is struggling to gain pace in the bullish zone, with negative signs.
Hourly RSI – The RSI for ETH/USD is currently moving higher towards the 50 level, with a minor bullish angle.
Major Support Level – $211
Major Resistance Level – $224
The post Ethereum Price (ETH) Turns Bearish Below $220, Bitcoin Breaks $10.5K appeared first on NewsBTC.
by Aayush Jindal on July 23, 2019 at 08:38AM
